Resources

Segmental Retaining Wall Global Stability

INTRODUCTION

The general mass movement of a segmental retaining wall (SRW) structure and the adjacent soil is called global stability failure. Global stability analysis is an important component of SRW design, particularly under the following conditions:

  • groundwater table is above or within the wall height of the SRW,
  • a 3H:1V or steeper slope at the toe or top of the SRW,
  • for tiered SRWs,
  • for excessive surcharges above the wall top,
  • for seismic design, and
  • when the geotechnical subsurface exploration finds soft soils, organic soils, peat, high plasticity clay, swelling or shrinking soils or fill soil.

The designer should also review local code requirements applicable to designing soil retention structures.

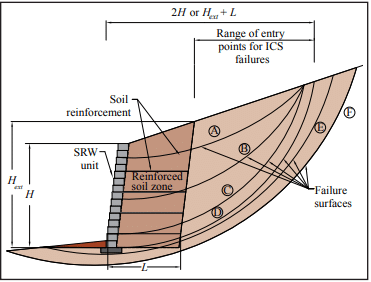
There are two primary modes of global stability failure: deep-seated and compound. A deep-seated failure is characterized by a failure surface that starts in front of an SRW, passes below the base of the wall and extends beyond the tail of the geosynthetic reinforcement (see Figure 1, surface F).

Compound failures are typically described by a failure surface that passes either through the SRW face or in front of the wall, through the reinforced soil zone and continues into the unreinforced/retained soil (Fig. 1, surfaces A through E). A special case of the compound failure is the Internal Compound Stability (ICS) failure surface that exits at the SRW face above the foundation soil (Fig. 1, surfaces A through D).

GLOBAL STABILITY ANALYSIS

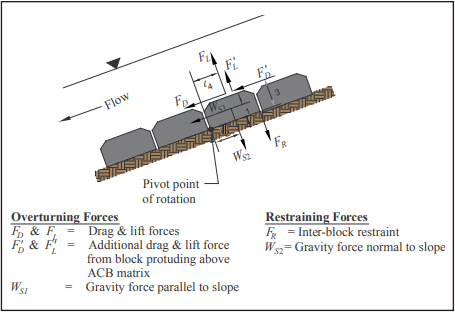
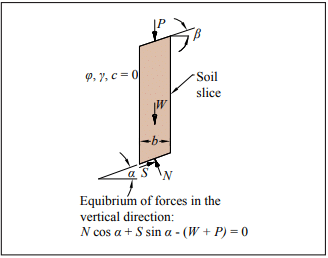
Several methods of analysis (such as Janbu, Spencer and Bishop) have been developed to analyze the global stability in a soil mass. The Bishop’s method is the most commonly used. It models a group of slices and the forces acting on each slice as shown in Figure 2. Limit equilibrium requirements are applied to the slices comprising the soil structure. The factor of safety against sliding is defined as the ratio of the maximum shear possessed by the soil on the trial failure surface plus contributions from the soil reinforcement (τavailable) to the shear resistance developed along the potential failure surface (τmobilized), i.e.:

FS= τavailablemobilized or resistance/driving.

Limit equilibrium methods of analysis are typically used to determine the global stability of the SRW. These methods assume that the SRW, the retained soil, and the foundation soil will fail along a critical slip (failure) surface generated by the force of gravity. The critical slip surface is commonly assumed as a circular arc, logarithmic spiral arc, curve, single plane or multiple planes to simulate the possible sliding movement.

In most limit equilibrium analyses, the minimum shear strength required along a potential failure surface to maintain stability is calculated and then compared to the available shear strength of the soil. The factor of safety is assumed to be constant along the entire failure surface. The design factor of safety for global stability is typically between 1.3 and 1.5, and depends on the criticality of the structure and how well the site conditions are defined.

The global stability analysis is an iterative process where as many as 250 trial failure surfaces are assumed and analyzed to determine the critical failure surface (i.e. minimum factor of safety). For this reason, the slope stability analyses are usually performed using computer programs that implement one or more methods. Many software programs have been developed to analyze the global stability of unreinforced soil structures. There are, however, only a limited number of programs that include the stabilizing effects of the geosynthetic reinforcement used to construct a soil-reinforced SRW. ReSSA (ref. 1) is one of the specialized programs developed for the Federal Highway Administration.

Internal Compound Stability

Internal Compound Stability (ICS) affects the internal components of the retaining wall system, including the facing elements and reinforced zone. Because ICS is influenced by loading conditions outside the reinforced fill area, it is a special case of a larger compound analysis.

The CMHA Design Manual for Segmental Retaining Walls (ref. 3) provides specific guidelines for ICS analysis. The failure surfaces are evaluated by defining a range of possible entry points located behind the soil-reinforced SRW and exit points at the face of the wall. The entry points are located at a distance that is the larger of twice the wall height (2H) and the height of the projection from the tail of the reinforcement layers to the surface plus a distance equal to the length of the reinforcement (Hext + L) (see Figure 1).

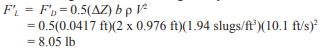
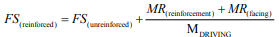
To analyze the ICS failure on soil-reinforced SRWs, the components of the SRW (soil reinforcement and facing) are considered to help resist the unbalanced forces of the system:

To simplify the ICS analysis, CMHA has developed SRWall 4.0 Software (ref. 2).

Factors Affecting the Global Stability and Internal Compound Stability (ICS) of SRWs

The global factor of safety of an SRW is a function of: the soil characteristics, groundwater table location, site geometry (i.e., sloping toe or crest, tiered walls), and the length, strength and vertical location of soil reinforcement (geosynthetic). The effects of each of these are briefly discussed below.

Soil Characteristics—Weak foundation soils increase the potential for deep-seated stability problems. Low strength reinforced soil will contribute to compound stability problems and low strength retained soils may contribute to either deep-seated or compound failure modes.

Groundwater Table—If the groundwater table is shallow (i.e., close to the toe of the wall) the long-term shear strength (i.e., effective shear strength) of the foundation soil will be reduced. This reduction in strength is directly related to the buoyant effect of the groundwater. The effective weight of the soil is reduced by approximately 50%, which reduces the shear strength along the failure surface.

Geometry—A sloping toe at the bottom of an SRW reduces the resisting forces when analyzing failure surfaces exiting in front of the SRW (deep-seated or compound). As the resisting force decreases, the global factor of safety also decreases. The ICS does not evaluate the influence of front slopes on the stability of SRWs.

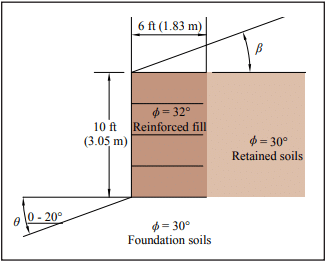
Figure 3 illustrates the design case for a parametric analysis with top and toe slopes condition for a 10-ft (3.05-m) high wall with a horizontal crest slope founded on a foundation soil with a friction angle of 30°.

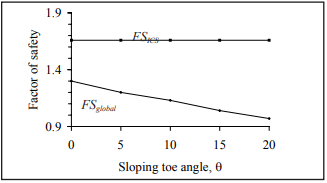
Figure 4 shows the change in factor of safety for deep-seated failure as a function of the toe slope angle. However, ICS analysis is not influenced by these changes and remains constant for the different toe variations.

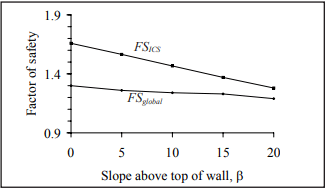
An increase of the slope above the wall decreases the SRW global stability factor of safety. Figure 5 shows the change in factor of safety for the design case used earlier (with the exception that the toe is level and the crest slope varies). In this case, evaluation of the wall with this geometry shows a larger reduction in safety factor for ICS than for global stability.

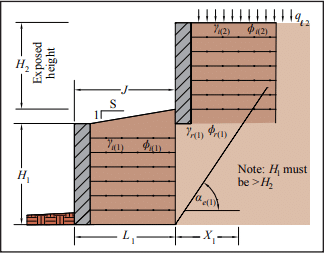
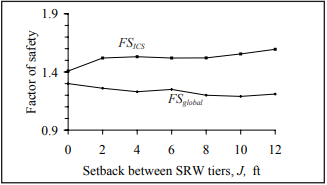
Tiered Walls—The CMHA Design Manual for Segmental Retaining Walls (ref. 3) provides specific guidelines for tiered SRWs with respect to the spacing between tiers and the effect of the upper wall on the internal and external stability of the lower wall (see Figure 6). When the setback of the upper wall, J, is greater than the height of the lower wall, H1, the internal design of the lower wall is not affected by the upper wall. However, this is not true for global stability. Global stability must be checked for all tiered walls.

Figure 7 shows the variation in the global factor of safety for two 10-ft (3.05-m) high tiered walls with horizontal crest slopes as a function of the setback J. In this example, the reinforcement length for both walls is 12 ft (3.66 m), which is 0.6 times the combined height of both walls. For this particular example, constructing a tiered wall versus a single wall 20 ft (6.10 m) high (i.e., J = 0) reduces the global factor of safety from 1.3 to 1.2. From the ICS analysis, a tiered wall has better safety factors and the stability is increased when the distance between tiers is increased.

Soil Reinforcement—Generally speaking, increasing the spacing between reinforcement layers increases the potential for compound failures. Shortening the length of the reinforcement will also increase the potential for both compound and deep-seated failure. Changes in the design strength of the reinforcement often have the smallest impact on the global stability.

CONCLUSIONS

The global stability analysis (deep-seated and compound) of an SRW is an important consideration during the SRW design stage in order to assess the overall wall performance and the coherence of the system. Whenever the structure is influenced by weak soils, ground water tables, slopes at the top or toe of the structure or seismic conditions, an experienced professional should verify that all possible failure conditions have been evaluated.

When the global factor of safety of an SRW is below the design requirement, stability may be increased by increasing the reinforcement length or strength, or by decreasing the space between reinforcement layers. If the changes on the internal structure of the SRW do not improve the factors of safety, soil characteristics can be improved, water can be addressed with appropriate management and geometry can be modified.

When designing SRWs with these conditions, it is important to maintain the coordination among the appropriate professionals to help ensure the success of the job. Consideration must also be given to the impact that each variable has on the SRW stability:

  • Increasing the foundation, reinforced and/or retained soil shear strength (using ground improvement techniques or changing soil type).
  • Adding external and internal drainage features reduces surcharges and improves soil properties.
  • When a slope occurs at the toe of a wall, changing the geometry of the wall slope may also increase stability. For example, placing the SRW at the bottom of the slope and having a slope above the wall instead may increase the stability to an acceptable level.
  • A change in the toe slope has a more drastic effect on FSglobal than does a change in the slope above the wall.
  • An increase in the slope above the wall reduces the ICS safety factor more than the global stability safety factor.

Global stability analysis is a complex analytical procedure. However, computer software is available which greatly reduces the time required for the analysis.

NOTATIONS:

b                          = width of slice, ft (m)
c                           = cohesion of soil, psf (MPa)
FS                        = factor of safety
FSglobal                  = global factor of safety
FSICS                   = ICS factor of safety
FS(reinforced)        = the reinforced factor of safety of the soil
FS(unreinforced)     = unreinforced factor of safety of the soil
H                           = total height of wall, ft (m)
Hext                       = height of back of reinforced wall over which the active earth pressure for external stability is calculated, ft (m)
H1                              = height of lower wall for tiered SRWs, ft (m)
H2                          = exposed height of upper wall for tiered SRW, ft (m)
J                             = setback between SRW tiers, ft (m)
L                             = length of geosynthetic soil reinforcement, ft (m)
MR(reinforcement)    = the resisting moment generated by the reinforcement layers that intercept the slip surface
MR(facing)               = the resisting contribution of the facing at the exit of the potential slip circle.
MDRIVING               = the driving force generated by the weight and surcharges present on the potential slip circle.
N                             = total normal force, N = N’ + ul, lb/ft (N/m)
N’                            = effective normal force, lb/ft (N/m)
P                              = external load, lb/ft (kN/m)
ql                              = soil surcharge, lb/ft² (N/m²)
R                              = radius of the circular slip failure, ft (m)
S                               = ratio of horizontal offset to vertical rise between tiers of slope
W                             = total weight of soil in slice plus surcharge if present, lb/ ft (N/m)
X1                             = length of influence zone for upper tier, ft (m)
αe                             = orientation of the critical Coulomb failure surface
β                              = soil slope above top of wall, degrees
γ                              = soil unit weight, pcf (kN/m³)
θ                              = toe angle, degrees
Φ                             = friction angle of soil, degrees
τavailable                  = maximum shear strength possessed by the soil on the trial failure surface plus contributions from soil reinforcement, lb/ft (N/m)
τmobilized                 = shear resistance necessary for equilibrium, lb/ft (N/m)

REFERENCES

  1. ReSSA 1.0, ADAMA Engineering Inc., 2001.
  2. SRWall 4.0, Concrete Masonry & Hardscapes Association, 2009.
  3. CMHA Design Manual for Segmental Retaining Walls, 3rd edition. SRW-MAN-001-10, Concrete Masonry & Hardscapes Association, 2010.
  4. McCarthy, David F. Essentials of Soil Mechanics and Foundations: Basic Geotechnics, Fourth Edition, Regents/ Prentice Hall, 1993.

ACB Revetment Design— Factor of Safety Method

INTRODUCTION

This Tech Note is intended to help designers understand the ACB design methodology and the different variables influencing the design and safety factor selection. Articulating concrete block (ACB) systems provide erosion protection to soil exposed to the hydraulic forces of moving water. ACB systems are a matrix of individual concrete blocks placed closely together to form an erosion-resistant overlay with specific hydraulic performance characteristics. Because it is composed of individual units, the ACB system can conform to minor changes in the subgrade without loss of intimate contact. Systems may be connected through geometric interlock and/or other components such as cables. Systems with openings in the blocks can typically be vegetated to provide a “green” channel and facilitate infiltration/exfiltration of channel moisture. Figure 1 illustrates a variety of ACB systems, but is not all-inclusive of available systems.

ACB units are concrete block produced in accordance with Standard Specification for Materials and Manufacture of Articulating Concrete Block (ACB) Revetment Systems, ASTM D6684 (ref. 1). Units must conform to minimum compressive strength, absorption and geometric specifications tested in accordance with Standard Test Methods for Sampling and Testing Concrete Masonry Units and Related Units, ASTM C140 (ref. 2).

This Tech Note addresses the structural stability of ACB revetment systems as a function of site-specific hydraulic conditions and unit characteristics. This Tech Note does not address geotextile filter and/or subgrade filter design, minimum installation guidelines critical to the proper performance of ACB revetments, or minimum upstream or downstream toe treatments. These topics are covered in design manuals such as references 5 and 6.

FACTOR OF SAFETY METHOD

Similar to many rip rap sizing methods, the Factor of Safety method quantifies hydraulic stability of ACB systems using a “discrete particle” approach (see ref. 7). The design method involves balancing the driving and resisting forces, including gravity, drag and lift as illustrated in Figure 2. In typical channel and spillway applications, failure due to sliding (slipping) of the ACB revetment along the bed is remote. The revetment system is more apt to fail as a result of overturning about the downstream edge of the ACB unit, or downstream corner point when the ACB unit is located on the side slope of a steep channel. For cases where the revetment is placed on steep side slopes (2H:1V or steeper), the design should evaluate the potential for slip shear failures along geosynthetic-ACB unit interfaces induced by hydraulic and gravitational forces (i.e., potential slope instability).

Fundamental principles of open channel flow and rigid body mechanics are used along with hydraulic test results supplied by manufacturers. The size and weight of the ACB units, as well as performance data from full-scale laboratory testing, are considered in evaluating the ratio of resisting to overturning moments (the “force balance” approach). This ratio defines the factor of safety against uplift. The design procedure accounts for additional forces applied to the unit when protrusions above the matrix occur, such as subgrade irregularities or due to improper placement (see Figure 3). Failure is defined as loss of intimate contact between the ACB unit and subgrade. The effects of cables or rods, vegetative root anchorage or mechanical anchorage devices are conservatively ignored.

Target Factor of Safety

There are several factors that need to be understood and considered when evaluating the appropriate target safety factor for design purposes. These can be categorized into two groups; external and internal factors. The external group consists of factors such as the complexity of the hydraulic system, the uncertainty of the input hydraulics, and the overall consequence of failure. These uncertainties are accounted for in the design by incorporating them into the target safety factor.

As discussed below, there are multiple facets of the safety factor methodology that are considered as they relate to external and internal design factors.

External Factors
  1. Complexity of the hydraulic system and uncertainty of the input hydraulics.
    All hydraulic systems are not of the same complexity. Modeling the flow characteristics of a stream bank or channel is much different than the design of scour protection around bridge piers. If the flow is relatively uniform and predictable, then the designer may select a lower value for the target safety factor. As the complexity of the system increases, so too should the sophistication of the model used to determine the hydraulic parameters. Utilizing a simplistic model in a complex environment may warrant an increase in the target safety factor (i.e., greater than 1.5). Conversely, if a complex model is used to analyze a simplistic design scenario, then a lower target safety factor may be adequate (i.e., less than 1.5).
  2. Consequence of failure.
    As with the complexity of the hydraulic system, the overall consequence of failure needs to be understood. Failure that results in loss of life is much different from a failure resulting in soil erosion along a stream bank in which no loss of life or property is imminent. Increasing the target safety factor is one way of potentially offsetting environmental conditions that are considered high risk.
Internal Factors
  1. Extrapolation of Test Data.
    In order to use the safety factor methodology, the critical shear stress of the unit along a horizontal surface must be understood and quantified. An equation is used for the extrapolation of test results from a steeper bed slope to a horizontal slope. A second extrapolation takes place from the tested units to thicker, untested units. In both processes, it is assumed that the intra-block restraint is the same for all thicknesses of the units. Under this assumption, the extrapolation equations only consider the weight and thickness of the units. This moment balance approach (obtained from the geometry of the unit) neglects any intra-block restraint. This assumption can be very conservative given the fact that thicker units have much more intra-block friction than thinner units given the shape of the blocks. As illustrated in Figure 4, the bottom half of an ACB unit is essentially a rectangle of concrete with adjacent units resting against six surrounding units (because the units are placed in a running bond pattern, there are six adjacent units, rather than four). As the unit increases in thickness, so too does the intra-block friction. Currently, the safety factor methodology does not account for this variable, which only increases the conservatism of this design approach for such conditions.
  2. Performance Values.
    Hydraulic testing on different “footprint” or classes of blocks and tapers for a variety of dam overtopping and spillway applications has been performed by system manufacturers. In many of these tests, the testing facility was unable to fail the system under a 4 ft (1.2 m) and 5 ft (1.5 m) overtopping scenario. Nevertheless, the resulting shear stresses obtained from the tests are used within the safety factor methodology as a threshold, or failure, shear stress. This issue is compounded when extrapolating to thicker units. Without being able to reach a threshold condition in the testing flume, licensors and manufacturers extrapolate shear stress value from a stable value. A large degree of conservatism in the performance values of the units is the result of not being able to fail these systems under laboratory conditions.
  3. Interaction between Velocity and Shear Stress.
    In flume testing of the units (see Fig. 5), two of the most important results obtained are: a stable shear stress; and, velocity at a downstream point under the highest flow conditions.Consider for example testing results whereby the highest boundary shear stress and velocity obtained was 22.2 lb/ft² (1,063 Pa) and 26.1 ft/s (7.96 m/s), respectively. In the safety factor methodology one utilizes a shear stress of 22.2 lb/ft² (1,063 Pa) regardless of the expected design velocity for every design utilizing this particular unit (provided that the design velocity is less than or equal to the tested velocity). Common “hydraulic” sense would state that if the velocity was only 12 ft/s (3.66 m/s) for a given application, then the system could withstand a much larger shear stress than 22.2 lb/ft² (1,063 Pa). Therefore, an additional degree of conservatism is present when the design velocity is less than the tested velocity and the design utilizes the maximum shear stress generated during the higher velocity event.
  4. Allowable shear stress in a vegetated state.
    All of the testing on existing ACB systems has taken place in a non-vegetated state. In contrast, many ACB applications for overtopping and spillway applications seek a final system that is fully vegetated. A series of hydraulic tests conducted by the U.S. Army Corp of Engineers investigated the performance of identical ACB systems in both vegetated and non-vegetated conditions (ref. 14). The end result was an increase in the allowable shear stress of 41% when vegetated.

Taking into consideration all of the points addressed above, what is the proper target safety factor required for a dam overtopping or spillway application? It is safe to state that the methodology used for ACB design is full of conservative assumptions. From the fact that tapered ACB systems have not reached their threshold condition in the testing flume to the fact that vegetation increases the allowable shear stress, it is apparent that the resulting safety factor can be conservative by 20 – 50%. Therefore, a target safety factor of 1.3 – 1.5 is adequate for applications in which the design hydraulics and site geometry are clearly understood, such as dam overtopping or spillway applications. Ultimately, the “external” factors and overall design of the project will need to be evaluated and decided on by the engineer of record. It may also be appropriate for an individual experienced in ACB design to offer an opinion on how these factors should be incorporated into an overall target safety factor.

Hydraulic Considerations

The main hydraulic variable in ACB stability design is the total hydraulic load (or bed shear stress) created by a varying discharge within a fixed geometric cross-section. The ratio of designed average cross-sectional bed shear to the ACB’s critical shear value (obtained from testing) is used, in part, for practical analysis and evaluation of ACB stability. The cross-section averaged bed shear stress, τo, can be calculated for design using a simple equation (ref. 13):

τo = γ R Sf

τo is applied over the channel boundary, regardless of o channel lining. Shear stress is a function of the hydraulic radius and the slope of the energy line (for the simplest case—the bed slope), both defined by channel geometry and flow conditions.

The cross-section averaged bed shear stress is suitable for uniform flow conditions such as those found in long straight reaches of open channels with uniform cross section. It may be determined using simplified model approaches, such as the Manning equation or the HEC-RAS model (ref. 11). For cases involving bends, confluences, constrictions and flow obstructions, more sophisticated hydraulic modeling is generally appropriate, such as a two-dimensional model which can evaluate time-dependent flow conditions or complex geometry (ref. 10).

Design velocity is often determined using the Manning Equation for steady uniform flow as follows (ref. 13):

An iterative process is used to determine the flow depth, yo, because both the area and hydraulic radius are functions of yo. Cross-sectional averaged velocity of flow is then defined as V = Q/A. As noted previously, complex hydraulic systems require sophisticated modeling to determine averaged velocity.

The cross-sectional averaged bed shear stress and cross sectional averaged velocity should be determined by a design professional familiar with hydraulic design practices.

ACB Revetment Considerations

Historically, manufacturers of ACB systems published performance data from full-scale tests performed in accordance with Federal Highway Administration guidelines (ref. 8). Two relatively new ASTM standards have been developed based on the FHWA method: Standard Guide for Analysis and Interpretation of Test Data for Articulating Concrete Block (ACB) Revetment Systems in Open Channel Flow, ASTM D7276 (ref. 3) and Standard Test Method for Performance Testing of Articulating Concrete Block (ACB) Revetment Systems for Hydraulic Stability in Open Channel Flow, ASTM D7277 (ref. 4), that eventually will replace the FHWA test method. This data provides the critical shear stress, τc, and is based on specific flow conditions and ACB system characteristics. The manufacturer should specify whether the critical shear stress is for a unit on a horizontal surface or on an inclined surface. Values for a unit on a horizontal surface are commonly specified. It is important that the designer consider the full-scale test configuration and hydraulic conditions used to derive the critical shear stress on a horizontal surface.

Testing involves the construction of a full-scale test embankment that is subsequently exposed to hydraulic load until failure—defined as the local loss of intimate contact between the ACB unit and the subgrade it protects. A schematic of a typical flume is illustrated in Figure 5. ACB system stability is evaluated by summing the driving and resisting moments about the toe of an individual ACB unit. The inter-block restraint, FR, is ignored, as is any contribution from cables, anchorages and vegetation (see Figure 2).

ACB placement or subgrade irregularities can result in one unit protruding above the ACB matrix, as shown in Figure 3. The protrusion height, ΔZ, is a function of installation practice and block-to-block interface, and is often assumed to be ¼ to ½ in. (6 to 13 mm). However, the designer must consider site-specific conditions and adjust ΔZ as required. The lift force, F’L, resulting from the protrusion is conservatively assumed equal to the drag force, F’D.

The established design methodology assumed that the flow was parallel to the block and calculated the drag forces using the block width perpendicular to the flow, b (see equation for F’D in Table 1 and Figure 6b). However, in the field not all ACB applications have the flow aligned with the sides of the block. To account for that uncertainty, it is recommended that the diagonal distance of the block, 2l2, be used instead of b in the drag force calculations (see Figure 6b). It is recommended that the designer analyze the project conditions and determine the appropriate dimension for determining the drag forces, F’D, and safety factors on each project. Examples of non-parallel flow conditions are open channels and levees where the flow alignment is uncertain during the life of the project.

The factor of safety against loss of intimate contact is considered to be a function of design bed shear stress, critical shear stress, channel geometry and ACB unit geometry and weight. Figure 2 illustrates unit moment arms based on unit geometry. The safety factor for a single ACB unit is determined from the ratio of restraining moments to overturning moments. Considering the submerged unit weight, WS, unit moment arms and drag and lift forces, the safety factor, SF is defined as (ref. 6):

Dividing by l1WS and substituting terms, the equation for SF resolves to that presented in Table 1. Table 1 also outlines the calculations necessary for determining factor of safety.

DESIGN EXAMPLE

A trapezoidal channel section with 3H:1V side slopes (Z = 3, θ1 = 18.4°) and a base width b of 15 ft (4.6 m) requires stabilization. The 100-year design discharge is 450 ft³/s (12.7 m³/s), and the channel slope So is 0.03 ft/ft (0.03 m/m) (θ0 = 1.72°). The channel has a uniform bed and no flow obstructions (i.e. confluences, bends or changes in geometry). Manning’s n is specified as 0.035. Based on design conditions, the energy grade line Sf is assumed equal to the channel slope So.

Step 1 Determine flow depth and cross-sectional averaged velocity:

R = A/P, hydraulic radius

By iteration, the flow depth yo is determined to be 2.1 ft (0.6 m).

Step 2 Calculate design shear stress:

Step 3 Select target factor of safety:
Based on the analysis of the project conditions, such as type of application, low consequence of failure and the empirical hydraulic model, the designer has recommended a target factor of safety, SFT, for the project of 2.34.

Step 4 Select potential ACB product and obtain geomorphic and critical shear stress data:
The proposed ACB manufacturer specifies a critical shear stress, τc, for the unit on a horizontal surface of 30 psf (1.4 kPa) for a maximum velocity of 20 ft/s (6.1 m/s), submerged unit weight of 38 lb (17.2 kg) and dimensions of 15 (w) x 18 (l) x 5 (h) in. (381 x 457 x 127 mm).

Step 5 Calculate factor of safety against incipient unit movement:
Given;
Ws = 35 lb (16 kg)
bu = 1.5 ft (460 mm)
τc = 30 psf (1.4 kPa)
ηo = 2.96/30 = 0.0987

and determining the following geometrically (see Figure 6);

and assuming (see discussion);
ΔZ = 0.0417 ft (13 mm)

the following are calculated using the equations in Table 1:

For this open channel application the flow is not considered to align with the block, so b = 2l2
aθ = 0.948
θ = 5.16°
β = 19.4°
η1 = 0.08
δ = 65.4°
SF = 2.43

Because the calculated factor of safety exceeds the target, the proposed ACB system is stable against loss of intimate contact.

An ACB Design Spreadsheet (ref. 15) that makes these calculations much easier is available free on request via the CMHA  web site.

NOTATIONS:

A = cross-sectional flow area, ft² (m²)
aq = projection of Ws into subgrade beneath block (Table 1)
b = width of channel base, ft (mm)
bu = width of ACB unit in the direction of flow, ft (mm)
FD = drag force, lb (kN)
F’D = additional drag forces, lb (kN)
FL = lift force, lb (kN)
F’L = additional lift forces, lb (kN) (Table 1)
FR = inter-block restraint, lb (kN)
lx = block moment arms, ft (mm)
n = Manning’s roughness coefficient
Q = design discharge, ft³/s (m³/s)
R = hydraulic radius (A/wetted perimeter), ft (m)
SC = specific gravity of concrete (assume 2.1)
Sf = energy grade line, ft/ft (m/m)
So = bed slope, ft/ft (m/m)
SF = calculated factor of safety (Table 1)
SFT = target factor of safety
V = cross-sectional averaged flow velocity, ft/s (m/s)
W = weight of block, lb (kg)
Ws = submerged weight of block, lb (kg) (Table 1)
Ws1 = gravity force parallel to slope, lb (kN)
Ws2 = gravity force normal to slope, lb (kN)
yo = flow depth, ft (m)
Z = horizontal to vertical ratio of channel side slope
β = angle of block projection from downward direction, once in motion, degrees or radians
γ = unit weight of water, 62.4 pcf (1,000 kg/m³)
ΔZ = height of block protrusion above ACB matrix, ft (mm)
δ = angle between drag force and block motion, degrees or radians
ηo = stability number for a horizontal surface (Table 1)
η1 = stability number for a sloped surface (Table 1)
θ = angle between side slope projection of WS and the vertical, degrees or radians (Table 1)
θ0 = channel bed slope, degrees or radians
θ1 = channel side slope, degrees or radians
ρ = mass density of water, 1.94 slugs/ft³ (1,000 kg/m³)
τc = critical shear stress for block on a horizontal surface, lb/ft² (kPa)
τdes = design shear stress, lb/ft² (kPa)
τo = cross-section averaged bed shear stress, lb/ft² (kPa)

REFERENCES

  1. Standard Specification for Materials and Manufacture of Articulating Concrete Block (ACB) Revetment Systems, ASTM D6684-04(2010). ASTM International, 2010.
  2. Standard Test Methods for Sampling and Testing Concrete Masonry Units and Related Units, ASTM C140-09. ASTM International, 2010.
  3. Standard Guide for Analysis and Interpretation of Test Data for Articulating Concrete Block (ACB) Revetment Systems in Open Channel Flow, ASTM D7276-08. ASTM International, 2010.
  4. Standard Test Method for Performance Testing of Articulating Concrete Block (ACB) Revetment Systems for Hydraulic Stability in Open Channel Flow, ASTM D7277-08. ASTM International, 2010
  5. Design Manual for Articulating Concrete Block Systems. Harris County Flood Control District, Houston, Texas, 2001.
  6. Design Manual for Articulating Concrete Block, ACBMAN-001-20. Concrete Masonry & Hardscapes Association, 2020.
  7. Bridge Scour and Stream Instability Countermeasures: Experience, Selection, and Design Guidance – 3rd Edition. Federal Highway Administration Hydraulic Engineering Circular No. 23.
  8. Clopper, P. E. and Y. Chen. Minimizing Embankment Damage During Overtopping Flow, Technical Report FHWA RD-88-181. Federal Highway Administration, 1988.
  9. Clopper, P. E. Hydraulic Stability of Articulated Concrete Block Revetment Systems During Overtopping Flow, Technical Report FHWA RD-89-199. Federal Highway Administration, 1989.
  10. RMA2 Version 4.5. United States Army Corps of Engineers. USACE Waterways Experiment Station, 2008.
  11. HEC-RAS Version 4.1. United States Army Corps of Engineers. USACE Hydrologic Engineering Center, 2010.
  12. Articulated Concrete Block for Erosion Control, ACBTEC-001-14, Concrete Masonry & Hardscapes Association, Herndon, Virginia, 2014.
  13. Morris, H. M. and J. Wiggert. Applied Hydraulics in Engineering, Second Edition, James Wiley & Sons, 1972.
  14. Lipscomb, C.M, C.I. Thornton, S.R. Abt, and J. R. Leech. Performance of Articulated Concrete Blocks in Vegetated and Un-Vegetated Conditions. Proceedings of the International Erosion Control Association 32nd Annual Conference and Exposition, Las Vegas, NV, February 5-8, 2001.
  15. Articulating Concrete Block (ACB) Design Spreadsheet, ACB-XLS-001-19. Concrete Masonry & Hardscapes Association, Herndon, Virginia, 2019.